At some point in every interview study, a researcher makes a judgment call that the data is sufficient. Usually this happens quietly, almost automatically: the last two sessions felt familiar, no new themes emerged, the team has a reasonable portfolio of evidence. You stop scheduling interviews. You move to synthesis. You deliver findings.
Then a stakeholder asks: "How do you know you've heard enough?"
The honest answer, in most research teams, is: "We don't, formally. We made a professional judgment." That answer is defensible to researchers who understand qualitative methods. It is not satisfying to a product leader who is about to commit engineering resources based on that judgment, or to a research director who needs to justify study scope to a budget owner.
This piece is about making saturation more than a judgment call — and about producing the kind of evidence that holds up when someone asks the question.
What Saturation Actually Means
Theoretical saturation as a concept comes from grounded theory — Glaser and Strauss, originally from 1967 — and refers to the point at which additional data collection produces no new theoretical categories. You've heard enough when new data is no longer changing your understanding of the phenomenon.
The research methods literature is honest about the ambiguity here. Sam Ladner, in Practical Research Methods for Human Centered Design, describes saturation as a goal rather than a threshold — something you work toward, and something you can assess only in retrospect, after synthesis. You can't know you've reached saturation before you've done the synthesis; you can only observe that your last round of synthesis produced nothing structurally new.
In practice, most research teams don't formally assess saturation at all. They run the number of interviews their budget or schedule allows, or they follow the informal heuristic that five to eight interviews is "enough" for qualitative discovery. The five-to-eight heuristic has some basis in the academic literature on problem detection rates — Nielsen and Landauer's work on usability testing suggested diminishing returns after around five participants — but it applies to usability testing specifically, not to discovery interviews, and it depends heavily on how homogeneous the user population is.
A heterogeneous enterprise user base — where a PM at a 50-person company uses your product very differently from a PM at a 500-person company — will reach saturation much later than a homogeneous segment. "Eight interviews is enough" can be true for the narrow segment and badly wrong for the mixed sample.
The Stakeholder Problem
The gap between "I made a professional judgment" and "here is the evidence that supports my judgment" has become more consequential as research teams operate in environments with more scrutiny. Research ops as a discipline — which Tomer Sharon helped define through his work at Google and later at WeWork — emerged partly because research practice in product organizations was too ad hoc to scale and too opaque to evaluate.
Part of that opacity was saturation. Research reports would say things like "findings based on ten interviews" without any indication of why ten was the right number, or whether the findings would have looked different with fourteen. For a stakeholder trying to evaluate the confidence level of a research claim, this is genuinely important information. It's the difference between "we ran interviews until we stopped finding new themes" and "here's the curve showing where new JTBD evidence per session flattened out."
The second version is auditable. You can look at it, understand the methodology, and make an informed judgment about whether to accept the saturation claim. The first version requires you to trust the researcher's judgment without any basis for calibrating that trust.
A Practical Framework for Tracking Saturation
The most tractable approach to making saturation visible — especially for JTBD-anchored research — is to track new evidence per session against your existing job statements. After each interview is synthesized, you ask: did this session produce any utterances that map to a job I haven't seen strong evidence for yet, or surface a new pattern I don't currently have a job statement for?
If the answer is consistently no for three or four consecutive sessions, you're approaching saturation for the framework you're working with. The sessions aren't generating new theoretical content — they're confirming what you already know, which is still useful (confirmation is evidence) but signals diminishing returns on additional data collection.
Tracking this per-session requires that you've already operationalized your JTBD framework as a synthesis lens — which is a prerequisite, not an afterthought. You need a defined set of jobs to evaluate evidence against. Without that, you can't measure whether evidence is "new" or "confirming" — everything is potentially new because the framework doesn't constrain interpretation.
What the Evidence Should Look Like
A saturation chart worth showing to stakeholders has at minimum these components: a session-by-session count of new JTBD evidence, a running total of confirmed jobs, and an annotation for when the curve flattened. If you're tracking evidence quality as well as quantity — not just "did this job appear" but "how strong was the mapping confidence" — the chart becomes more granular and more credible.
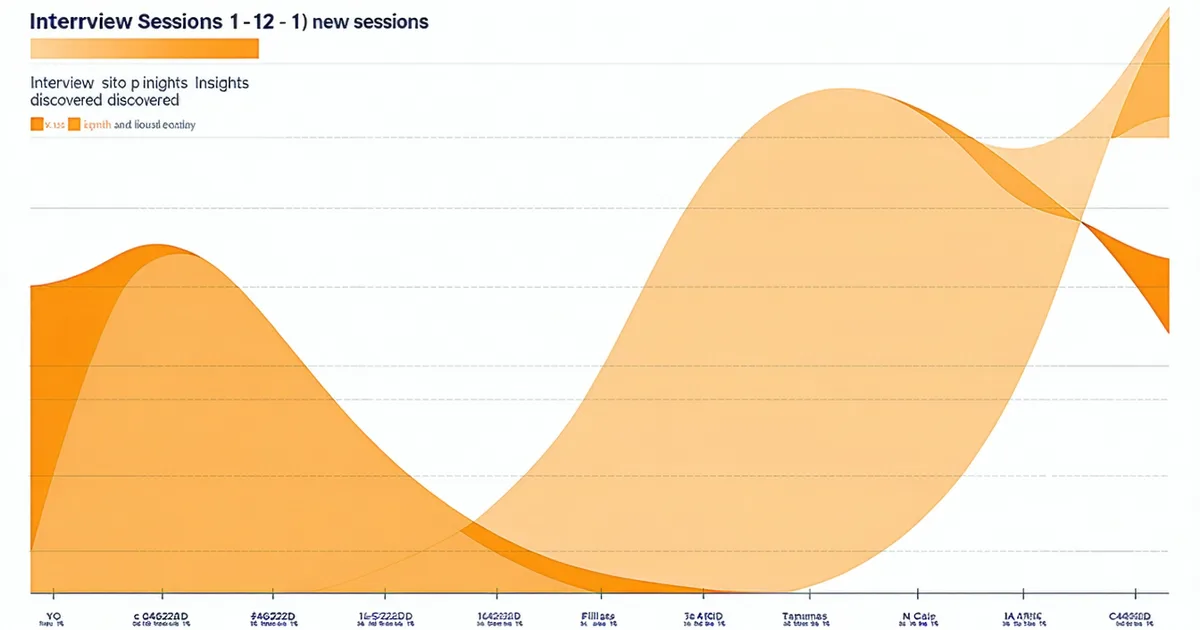
A research team at a growing B2B project management tool ran twelve interviews over six weeks, synthesizing after each session. By session eight, the saturation indicator showed that sessions seven and eight had produced no new JTBD evidence and had only confirmed patterns already well-established from sessions two through five. Sessions nine through twelve, which they ran anyway because they were already scheduled, confirmed the plateau. The saturation chart — new evidence per session, mapped against their five JTBD jobs — showed a clear curve flattening at session eight.
When they presented findings to their product leadership, the saturation chart was part of the research report. The CPO asked why they had run twelve rather than eight. The researcher explained: "We ran them because they were already scheduled. The saturation data confirms we could have stopped at eight and had the same findings. Next study, we'll build the saturation check into our stopping criteria so we can save four sessions' worth of time and participant cost."
That's a research ops win: the saturation evidence justified both the current study and informed the scope of the next one.
The Limit of Quantified Saturation
We're not saying that a saturation chart proves you've heard enough. No quantitative indicator eliminates the need for researcher judgment — that's not how qualitative methods work, and anyone claiming otherwise is misrepresenting the epistemology.
Erika Hall, in Just Enough Research, makes a point that resonates here: the goal of qualitative research is not to achieve certainty but to reduce uncertainty enough to make better decisions. Saturation is part of that uncertainty-reduction process. A saturation chart tells you that within your sample, with your synthesis methodology, new sessions are not changing your understanding. That's useful information. It doesn't tell you that participants you haven't interviewed yet would confirm the pattern.
What the chart does is make the evidence explicit rather than tacit. Instead of a researcher saying "I think we've heard enough" — which requires the listener to trust the researcher's undisclosed mental model — you have a document that shows the pattern of data accumulation over time. Stakeholders can look at it and form their own judgment. Some will be satisfied. Some will ask for more sessions. That's a legitimate conversation, and it's a better conversation than one that starts with an opaque assertion of professional sufficiency.
How to Build the Stopping Criteria Into the Study Design
The most disciplined research teams don't decide on stopping criteria after the data is in. They build them into the study design. Before the first interview, they specify: the framework we're testing evidence against, the threshold at which we'll evaluate saturation (e.g., three consecutive sessions with no new JTBD evidence), and the maximum session count regardless of saturation (usually set by budget or schedule).
Pre-specifying the stopping criteria means the saturation decision is less susceptible to motivated reasoning. If you're two sessions short of your planned twelve and the saturation curve has already flattened, you have a documented reason to stop early and redirect that time. If you've hit twelve and the curve is still rising, you have a documented reason to request additional sessions. In both cases, the decision is visible to stakeholders, traceable to an agreed methodology, and not purely at the discretion of whoever happens to be making the call that week.
GetWhys surfaces this as a saturation indicator per study — tracking new JTBD evidence per session and showing when the curve flattens. It doesn't make the stopping decision for you, but it produces the chart you'd want to show a stakeholder when they ask how you know you've heard enough. The indicator is a communication artifact as much as an analytical one: it turns an internal judgment into shareable evidence.
The Real Cost of Running Too Many Interviews
There's a tendency to treat "more interviews" as always better — more data is safer, more defensive. But recruitment costs time and money, and participant fatigue is a real consideration. Recruiting and scheduling a single interview typically requires four to eight hours of researcher and coordinator time, plus the participant's time. If a study of eight would have produced the same findings as a study of fourteen, those six extra sessions represent a real cost that could have been redirected to a different research question.
Research ops, as a discipline, is increasingly attentive to this. The question isn't just "did we do enough research?" but "did we do the right amount of research for this question, and could we have gotten the same answer faster?" Saturation tracking is one of the few tools that can answer the second question with evidence rather than speculation.