Synthesis that respects how you actually analyze interviews.
GetWhys isn't trying to replace your analysis — it's reducing the 3 hours between your last interview and the moment the PM asks "so what did users say?"
Built for researchers who need to show their work
GetWhys shows its work. Every quote card exposes: the exact transcript segment, the mapping logic to the JTBD job, the confidence score, and the session context. You can override any mapping. The synthesis is auditable — because your stakeholders will ask how you got there.
GetWhys does not write your research report. It does not generate themes from scratch or decide what is and isn't important. Those judgments belong to you. What it does is structure the evidence from what participants actually said, tagged to the job framework you already own, so you spend less time on transcript archaeology and more time on interpretation.
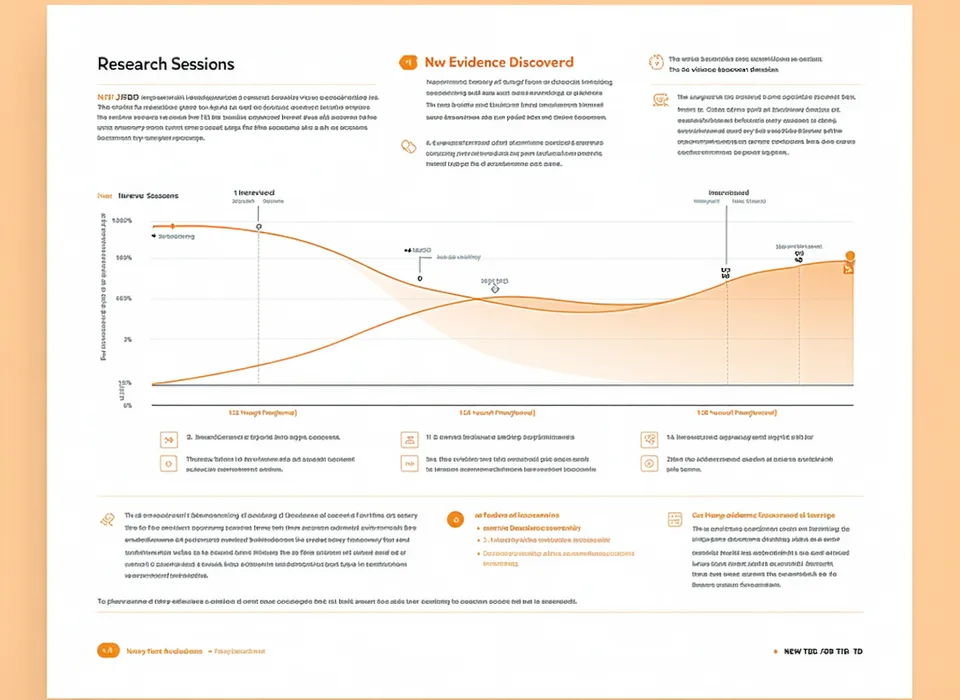
Saturation as evidence, not intuition
Research governance is increasingly being asked "how do you know you've heard enough?" GetWhys gives you a shareable saturation chart — new JTBD evidence per session — that shows the point of diminishing return in your study. Print it. Put it in your research report.
Build a portfolio of evidence over time
Every study you run in GetWhys adds to your workspace's JTBD evidence layer. When a product question resurfaces six months later, you can query: "What have users said about job X across all studies?" Your institutional knowledge doesn't leave with the last PM who had access to the spreadsheet.